Why your solar dashboard numbers do not add up
Why solar dashboard numbers can seem inconsistent in UK battery and EV homes, and how to check kW, kWh, import, export, battery and daily cost.
A solar dashboard can be confusing even when the hardware is working.
You might see the home using 2.4 kW now, 18 kWh of usage today, 12 kWh of grid import, 7 kWh of export, a battery that charged 9 kWh, and a supplier bill that does not look like any single chart. It is natural to ask whether one of the apps is wrong.
Sometimes it is. A CT clamp can be reversed, an EV charger can be missing from the picture, a tariff can be stale, or a dashboard can mix live data with the wrong date.
But many apparent mismatches come from a simpler issue: the numbers are answering different questions.
This guide is for UK solar, battery and EV homes that want a practical way to read dashboard numbers before changing settings, blaming the inverter, or assuming a tariff is not working.
The quick version: solar dashboard numbers
When a solar dashboard does not seem to add up, check these five things first:
kWis live power;kWhis energy over time.- Live power flow, today's totals, historical days and bills use different time windows.
- Grid import and grid export are directional values, not one simple net number.
- Battery charged and battery discharged are throughput numbers, so both can be high on the same day.
- EV charging can look like normal home usage unless the charger is measured and labelled separately.
The useful question is not "Why does every number fail to match at a glance?"
It is:
Which source, unit and time window owns this number?
That question catches most dashboard confusion without turning the check into an electrical audit.
First check the unit: kW is not kWh
The most common dashboard misunderstanding is mixing up power and energy.
kW is the rate of power right now. It is like speed.
kWh is the amount of energy used or generated over a period. It is like distance.
A kettle drawing 3 kW for ten minutes does not use 3 kWh. It uses about 0.5 kWh because it only ran for one sixth of an hour.
An EV charger drawing 7 kW for two hours uses about 14 kWh because the high load lasted long enough to become a large energy total.
That is why a live home-load card and a daily usage card should not be expected to match. A live value of 2 kW says what the home is doing at that moment. A daily value of 18 kWh says what happened across the day.
This also explains why the most dramatic live number is not always the most important cost number. A short high-power spike may barely change the day. A smaller load that runs all afternoon can matter more.
Then check the window: live flow, today, history and bills
A dashboard often contains several time windows on one screen.
They may include:
- live power flow, updated every few seconds or minutes;
- today's energy totals, usually reset at the home's local midnight;
- a selected historical day;
- tariff windows within that day;
- supplier meter data, which may arrive later;
- bill-period totals that follow the supplier account, not the dashboard view.
Those windows should be kept separate.
If you are looking at yesterday's battery behaviour, today's live grid power should not be treated as evidence for yesterday. If you are comparing a supplier bill, today's inverter total is not enough. If you are checking an EV charging session, the session start and end times matter more than the average day.
This is why home energy dashboard source of truth: what to check is a useful companion to this article. Source of truth is not only about which device reported a value. It is also about whether the value belongs to the right date, timezone and time window.
Import and export are directional, not one net number
Grid import is energy coming from the grid into the home.
Grid export is energy going from the home to the grid.
They are not the same thing as "net grid".
A home can import and export on the same day without anything being broken. For example, it may import during an overnight cheap-rate battery charge, then export spare solar at midday. The daily import and daily export both count because energy moved in both directions at different times.
This is especially important for homes with solar and batteries. The home may import at night to charge the battery, use solar during the day, export when the battery is full, then import again in the evening if the battery runs low.
Trying to reduce that whole day to one net figure can hide the useful story.
For billing, the distinction matters too. Import cost, export credit and standing charge are usually separate parts of the cost view. A dashboard that shows net daily cost should still be able to explain the import energy, export credit and standing charge behind it.
If import and export feel backwards at a live moment, that is different. A grid CT direction, source sign convention or mapping may need checking. The Zappi CT mapping guide for solar battery homes explains why direction and role matter when charger CT data is part of the picture.
Battery totals can be bigger than the battery size
Another common surprise is a battery chart where charged or discharged energy seems too high.
A 10 kWh battery can show more than 10 kWh of daily battery throughput if it cycles more than once. It might charge overnight, discharge into the morning, recharge from solar, then discharge again later.
That does not mean the battery capacity has changed. It means the battery moved energy in and out across the day.
There are three separate ideas:
- battery capacity: how much the battery can store;
- state of charge: how full it is now;
- throughput: how much energy moved into or out of it over a period.
Those values answer different questions.
Battery throughput is useful because it can show whether the battery is working harder than expected. For example, a daytime EV session may draw from the battery, then the battery may recharge later. The customer may only notice the side effect: the battery is lower than expected before the evening peak.
That problem is covered in more depth in why your home battery can drain when Octopus charges your EV and battery reserve floor: what UK solar homes should check. The dashboard lesson is the same in both cases: battery movement needs context, not just a single number.
EV charging changes the story if it is not separated
EV charging is often the largest flexible load in the home.
If a charger is not measured or labelled separately, an EV session may appear as a large home-load spike. That can make the battery look strange even when it is simply supplying a real load.
For example:
- the home load jumps from 0.8 kW to 7.8 kW;
- the battery starts discharging at the same time;
- grid import changes depending on the battery state and charger power;
- the daily home usage total rises sharply.
Without EV context, the customer may think the inverter or tariff made a poor decision. With EV context, the day may make sense: the car started charging, and the battery supplied part of that demand.
This is why a solar, battery and EV dashboard should not treat every watt as generic household demand. Where supported and configured, charger data can help explain whether energy went to the house, the battery, the car or the grid.
For setup checks, the Solis, Zappi and Octopus checklist is useful because it separates inverter data, charger context and tariff data instead of assuming one source explains the whole home.
Cost views need tariff windows, not just total import
A daily import total is not enough to explain daily cost in a time-of-use home.
The timing of the import matters.
Ten kWh imported overnight can have a very different cost from ten kWh imported during an expensive period. Export credit, standing charge and manual tariff settings can also change the final view.
That is why a cost view should be able to answer:
- how much energy was imported;
- when it was imported;
- which tariff source supplied the rate;
- whether the export rate is known;
- whether the standing charge is included;
- whether the selected day uses the right tariff for that day.
If those ingredients are missing, a dashboard should not pretend the cost is certain.
For non-Octopus or unsupported tariff cases, manual tariff setup for solar battery and EV homes explains why import periods, export rate and standing charge need to be entered carefully before trusting cost views or automation.
When zero is real and when it is unknown
Zero is only useful when it is a real measurement.
Solar at 0 kW at night is normal. Solar at 0 kW on a no-solar home is misleading if the dashboard presents it as an installed solar system. A missing tariff rate shown as 0p/kWh can be worse than a blank value because it looks like a real price. A disconnected EV charger shown as 0 kW may hide the fact that the app has no live charger state.
A careful dashboard should distinguish:
- real zero: the device is measured and currently doing nothing;
- pending: setup or first telemetry has not completed;
- stale: the last value is old;
- unavailable: the source cannot provide that number;
- not applicable: the home does not have that equipment.
This is why saved credentials should not be treated as a complete connection. The difference between selected devices, verified credentials, live telemetry and enabled control is explained in why saved credentials do not mean your energy device is connected.
The practical rule is simple:
Unknown should not be dressed up as zero.
That protects the reader from changing settings based on a number that was never actually measured.
A practical check for one confusing day
When a dashboard day looks wrong, do not start by checking every chart.
Pick one confusing day and run this sequence:
- Confirm the date and timezone. Make sure you are not mixing today, yesterday and a supplier billing period.
- Separate live power from daily energy. Do not compare a current
kWvalue with a dailykWhtotal as if they are the same type of number. - Check grid import and export separately. Ask when each direction happened.
- Check battery state of charge around the confusing period. A drop during EV charging or evening demand may explain the daily totals.
- Check whether the EV charged that day. If it did, ask whether the dashboard shows EV energy separately.
- Check the tariff source. Confirm whether the rates came from a supported supplier sync or manual tariff setup.
- Look for stale, pending or unavailable states. Do not treat missing data as a measured zero.
This gives you a customer-safe first pass before changing battery reserve, export behaviour, tariff settings or EV charging mode.
If you still cannot explain the day, the next step is source ownership: which app owns the meter value, which app owns inverter values, which app owns EV context, and which source owns the tariff. That is usually more productive than trying to force every chart into one balance equation by hand.
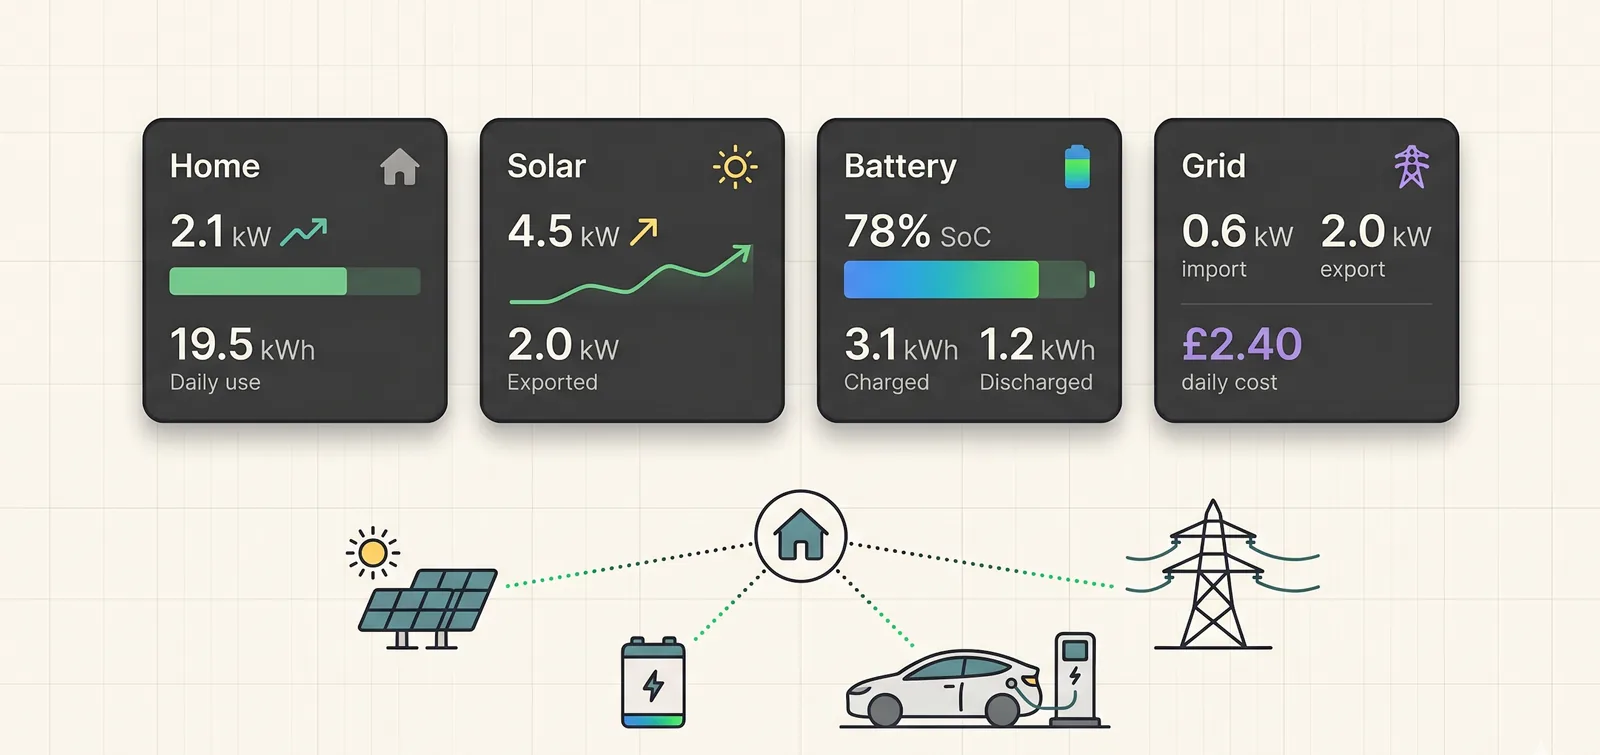
Why 1app.energy separates Home, Solar, Battery and Grid views
A useful home energy dashboard should not force every number into one card.
In 1app.energy, the main views are separated because each one answers a different customer question.
The Home view is about the whole property. It brings together live home load, today's consumption, self-sufficiency, supply mix and net daily cost. It is the place to ask:
What did the home need today, and where did that energy come from?
The Solar view is about production and destination. It separates live solar power, total generation, self-use, export and hardware diagnostics. It is the place to ask:
What did the solar produce, and where did it go?
The Battery view is about storage behaviour. It separates live charge or discharge power, state of charge, charged and discharged energy, and the source or destination of battery movement where the supporting data is available. It is the place to ask:
Did the battery charge, hold or discharge at the right time?
The Grid view is about the boundary with the supplier. It separates live grid power, daily import, daily export, tariff context, cost and standing charge. It is the place to ask:
What crossed the grid meter, and what was the tariff context?
Those views should relate to each other, but they should not all show the same number. A solar generation total, a battery throughput total, a home usage total and a grid import total are different measurements from the same day.
The point is to make the relationship understandable, not to pretend every card is interchangeable.
How 1app.energy handles these dashboard questions
1app.energy is built around a simple customer problem: renewable homes often have good hardware, but the customer still needs one clear place to understand solar, battery, EV charging and tariff behaviour.
For supported homes, 1app.energy can help by keeping those dashboard questions separate before it tries to explain the day:
- live power flow in
kWorW, so the customer knows what is happening now; - daily energy totals in
kWh, so the customer knows what happened across the selected day; - grid import and export as separate directions, so overnight charging and daytime export do not get flattened into one vague net value;
- EV charging context where supported;
- tariff-aware cost views where rates are available;
- delayed, pending or unavailable data states where the source is not ready;
- battery or tariff-aware control only where the setup is verified, supported and customer-enabled.
That caution is intentional.
The goal is not to make every number look tidy. The goal is to show the customer which number is live, which number is a daily total, which source owns it, and whether it is safe to act on.
For Solis hybrid inverter and Solis inverter homes, that can help close the customer software gap: one app for solar, battery, EV and tariff, without pretending every integration or control path is available for every home.
Common questions about solar dashboard numbers
Should home usage equal solar plus grid minus export?
Not always in a simple way.
Home usage, solar generation, battery charge, battery discharge, EV charging, import and export can all be measured over different branches and time windows. A backend-owned daily summary can reconcile those values more safely than a quick manual equation from visible cards.
Why does my app show grid import and export on the same day?
Because the home moved energy in both directions at different times.
For example, it may import overnight to charge a battery, then export spare solar later. That is not automatically a fault. The timing, tariff and battery behaviour decide whether it was useful.
Why can battery charged kWh be higher than my battery capacity?
Because charged kWh is throughput over a period, not the battery's size.
A battery can charge, discharge and charge again on the same day. The daily charged total can therefore exceed the usable capacity, especially in homes with solar, EV charging or tariff-aware behaviour.
Why does live power not match daily energy?
Live power is a snapshot. Daily energy is an accumulated total.
A high live value for a short time may add little to the day. A modest load running for many hours can add a lot. Always check whether the number is kW or kWh before comparing it.
Why do the Home, Solar, Battery and Grid tabs show different totals?
Because each tab groups the day by a different question.
Home is about the property demand and whole-home result. Solar is about generation and where that generation went. Battery is about storage movement and state of charge. Grid is about import, export, tariff and cost.
Those values should tell a coherent story together, but they are not meant to be identical.
Why is my supplier bill different from my inverter dashboard?
The supplier bill normally follows supplier meter data and billing rules. The inverter dashboard follows inverter or device telemetry. Differences can come from timing, missing data, import/export treatment, standing charge, VAT, tariff periods or supplier settlement.
That does not mean either source is useless. It means the bill and the dashboard may be answering different questions.
Should a dashboard show zero when a device is not connected?
No. If a device is not connected, not verified or not applicable, the dashboard should say that rather than show a confident zero.
Zero should mean a measured value of zero. Unknown should stay pending, unavailable or hidden, depending on the situation.
Final thought on solar dashboard numbers
Most solar dashboard confusion starts when useful numbers are compared without their source, unit or time window.
Before changing settings, ask what each value is: live power or daily energy, import or export, measured zero or unknown, tariff-synced or manually entered, whole-home load or EV-specific demand.
That one discipline turns a messy dashboard day into a practical investigation.
Visit 1app.energy/signup to check your inverter and start signup.
Does this sound like your home?
Your setup might already qualify.
Tell us which devices and tariff you are on. We review every request and invite in order of fit, not sign-up date.