How to read your inverter data to spot energy waste
Your inverter app shows a lot of numbers. Which ones actually tell you the system is working efficiently? Here is what to look for and the warning signs.
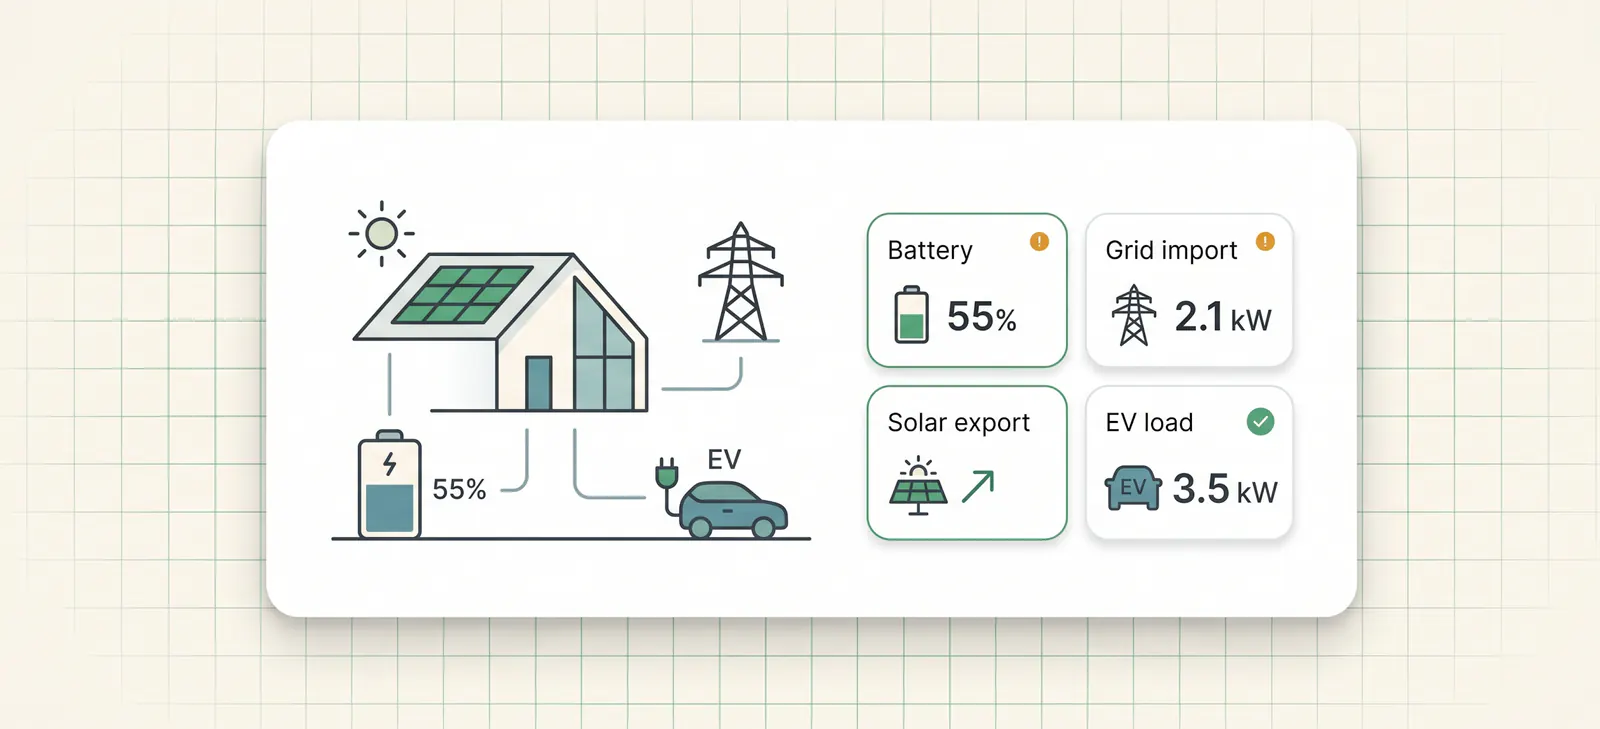
Every home battery system comes with an app. Most homeowners open it occasionally to check that the solar is generating or that the battery is not empty. Few know which numbers to watch to spot whether the system is actually performing efficiently, or quietly using energy in the wrong order.
Here is a practical guide to reading your inverter data, focused on the numbers that matter most for battery homes on smart tariffs.
The four inverter numbers that reveal energy waste
1. Battery state of charge at 17:00 to 18:00
This is the single most informative data point for a battery home on a smart tariff.
For many battery homes on a smart tariff, a useful check is whether the battery has enough charge for the evening peak, when grid rates are often highest and solar has dropped off. As a rule of thumb, if your battery is consistently below 60% at 17:00 on days with reasonable solar generation, it may be worth checking whether stored energy is being consumed before evening demand.
Common causes:
- Daytime EV sessions from Intelligent Go discharging the battery
- Heat pump afternoon cycle consuming stored energy before sunset
- Battery discharging to export when the export rate does not justify it
What to do: Check the battery SoC chart for any day you saw a higher-than-expected evening grid import. Look for drops in SoC during the middle of the day that do not correspond to high household consumption.
2. Solar self-consumption ratio
Most inverter apps show a self-consumption percentage, the proportion of solar generation consumed directly in the home or via the battery, rather than exported. As rough rules of thumb, a higher self-consumption ratio can indicate a well-configured system, but the "right" figure depends on the season, battery size, export tariff, household demand and whether the home is intentionally exporting.
A consistently low self-consumption ratio may point to one of:
- The battery is full when solar peaks and you are forced to export at a lower rate
- The battery is not sized appropriately for your generation and demand
- EV charging is happening from the grid during off-peak rather than from solar
What to do: Check whether the battery reaches 100% SoC before midday on sunny days. If so, solar is being exported when it could be stored, or you need a larger battery or more demand during the day.
3. Grid import timing on your inverter app
Your inverter app's import chart shows when you drew from the grid and how much. The pattern matters more than the total.
Efficient pattern: Grid imports concentrated in the overnight cheap window (00:30–05:30 for Go). Minimal imports during peak hours (16:00–21:00). Near-zero imports during solar hours on good generation days.
Warning signs:
- Significant imports between 16:00 and 21:00 despite the battery having been charged overnight, battery may have been drained during the day
- Imports at 22:00–00:30 (before the cheap window opens) suggesting the battery ran out before cheap electricity was available
- Large imports at unexpected times on days with daytime Intelligent Go sessions
What to do: On any day with higher peak-hour imports than expected, cross-reference with the battery SoC chart and your EV session history. If the battery SoC dropped significantly at 13:00–15:00, an EV session is the likely cause.
4. Battery cycle count and daily throughput
Most inverter apps show total energy throughput through the battery, sometimes as a lifetime figure, sometimes as daily stats. This tells you how hard the battery is working.
A 10kWh battery doing one full charge/discharge cycle per day may be normal for some homes. A battery doing 1.5–2 cycles per day is worth investigating, it can be a sign that it is being drawn into EV loads during the day and then recharged from solar or grid before the evening.
Avoid putting a fixed cash value on each extra cycle. Warranty terms, battery chemistry, depth of discharge, temperature and usable capacity all affect degradation. The practical point is simpler: avoidable extra cycling uses part of the battery's finite cycle budget without delivering useful value to the home.
What your inverter app does not show you
The most important gap in all consumer inverter apps is cross-device context. Your inverter knows:
- What the battery did
- What solar generated
- What the grid supplied
It does not know:
- Whether a battery discharge at 13:30 was because of an Intelligent Go EV session
- Whether your heat pump running at 05:45 drew from the battery or the grid
- Whether the import at 22:15 was avoidable if the cheap window had been anticipated
This context, which device caused which load, and whether the grid or battery supplied it, requires data from multiple systems simultaneously. The inverter sees the effect; it cannot see the cause.
A practical weekly inverter data routine
If you want to catch energy waste early, check these three things once a week:
-
Battery SoC at 17:00 on the two most recent sunny days. If it is consistently below about 60%, check the midday SoC chart for unexplained drops.
-
Peak-hour imports for the past week (16:00–21:00 each day). If these are consistently high despite the battery charging overnight, the battery is not reaching the evening with enough charge.
-
Any days where the EV session log shows a daytime charge. Cross-reference those days with the battery SoC chart. If the battery dropped significantly during the session, stored solar may have been used by the car.
These checks take five minutes a week and will surface most common problems within a month of monitoring.
These checks are also useful before changing control modes. If the battery is consistently low by the evening, read which 1app.energy Smart Control mode should you use before making the setup more aggressive.
Common questions about inverter data and energy waste
What is the most important inverter number to check?
For many battery homes on smart tariffs, battery state of charge at the start of the evening is the best single clue. If the battery is low after a good solar day, look for a midday EV session, heat-pump load or unexpected export.
Why do my solar dashboard numbers not match my bill?
Your inverter app, EV charger and supplier bill measure different parts of the home. Timing, export, battery throughput and tariff periods can make the numbers look inconsistent. We explain this in why solar dashboard numbers do not add up.
Is a high self-consumption percentage always good?
Not always. High self-consumption can be good when it means the home used valuable solar. But if the battery discharged into an EV session that should have used cheap grid power, high self-consumption may hide poor timing.
How often should I check inverter data?
Once a week is enough for most homes. Focus on days with daytime EV charging, unexpectedly high grid import or a battery that did not reach the evening with enough charge.
Can 1app.energy replace my inverter app?
No. Your inverter app remains useful for manufacturer-specific detail. 1app.energy is designed to add whole-home context where supported, so battery, solar, EV and tariff behaviour are easier to interpret together.
Related reading for inverter data checks
- Home energy dashboard source of truth: what to check
- Why Octopus can drain a home battery during EV charging
Final thought on inverter data
Inverter data is useful, but it is only one part of the home. The strongest signal comes when inverter data is read beside EV charging, tariff windows and the supplier meter.
If your monitoring is showing patterns like these, battery low in the evening, daytime SoC drops, higher peak imports than expected, read how 1app.energy can help coordinate them where supported.
Does this sound like your home?
Your setup might already qualify.
Tell us which devices and tariff you are on. We review every request and invite in order of fit, not sign-up date.